More Post from the Author
- Le Costa Rica redouble ses efforts de promotion des investissements en Europe dans les secteurs des technologies agricoles, des services mondiaux et des infrastructures touristiques
- Modular Building Institute Names Matt Slataper President of the Board of Directors
- ePlus Announces Fourth Quarter and Fiscal Year 2026 Earnings Release Date and Conference Call
- AARP Mississippi Applauds Passage and Signing of law to Protect Consumers from Cryptocurrency Kiosk Fraud
- Use.AI Launches Unified AI Workspace Platform to Improve Daily Workflows
SILVER ONE'S ZTEM AIRBORNE GEOPHYSICAL SURVEY OUTLINES POTENTIAL PORPHYRY COPPER AND ADDITIONAL SILVER EXPLORATION TARGETS AT PHOENIX SILVER, ARIZONA. NEW CLAIMS STAKED
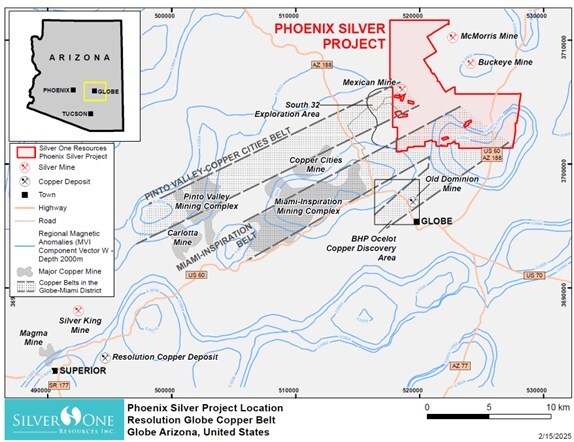
VANCOUVER, BC, Feb. 20, 2025 /PRNewswire/ -- Silver One Resources Inc. (TSXV: SVE) (OTCQX: SLVRF) (FSE: BRK1)("Silver One" or the "Company") is pleased to announce the completion of the geophysical processing and 3D modelling of helicopter-borne electromagnetic data from the ZTEMsurvey (Z-Axis Tipper Electromagnetic)conducted in October 2024 at its Phoenix Silver Project located near Globe, Arizona (See company's news release of October 7, 2024 and Figure 1). The survey and processing were done by Geotech LTD ("Geotech"). Geotech's processing, 3D-modelling, and targeting analysis have identified several significant anomalies potentially related to copper and silver mineralization. Anomalies identified include two priority copper targets and five priority silver targets, all recommended for further exploration (Figure 2).
 anomalies which are spatially coincident with the mineral belts of the Miami-Globe copper district.")
 over the ZTEM3D -300 m resistivity depth slice. Dashed black circles show the priority porphyry targets (Defiance and Quartz Ridge \"QR\") for reference. Copper values shown are from select rock samples.")
 300 meter depth. Note copper targets in black dashed line defined by a magnetic low surrounded by a relatively high magnetic halo. Right. 3D-ZTEM resistivity inversion 500 meters depth: the red and light-red ovals within the magnetic lows represent conductive zones potentially associated to copper sulfides. Defiance and QR targets are 4 and 8 square kilometers in size, respectively. North-South sections on these porphyry targets are shown in Figure 4.")


More Post from the Author
- Le Costa Rica redouble ses efforts de promotion des investissements en Europe dans les secteurs des technologies agricoles, des services mondiaux et des infrastructures touristiques
- Modular Building Institute Names Matt Slataper President of the Board of Directors
- ePlus Announces Fourth Quarter and Fiscal Year 2026 Earnings Release Date and Conference Call
- AARP Mississippi Applauds Passage and Signing of law to Protect Consumers from Cryptocurrency Kiosk Fraud
- Use.AI Launches Unified AI Workspace Platform to Improve Daily Workflows